Image: Pixabay
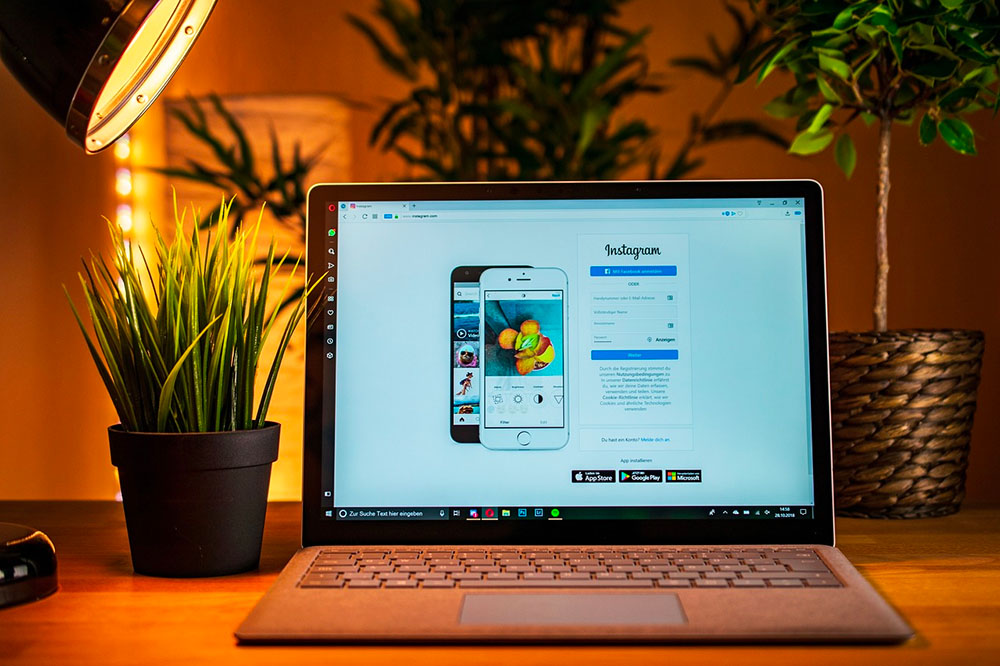
Over the years, Instagram has evolved from a photo-sharing platform to a photo and video-sharing social network. We’ve quite literally seen it change and evolve right before our ears throughout the years and witnessed the rollout of many new features such as:
- Reels: This feature allows users to create short, 15-second videos to music and share them with their followers. Think TikTok or Vine.
- IGTV Series: Similar to Youtube’s playlist, this feature allows content creators to group their IGTV videos into a series, making it convenient for viewers to find and watch their desired content – in categories.
- Guides: Instagram Guides allow for the curation of posts based on a specific topic. It has a striking resemblance to blogging except that it's only discoverable by followers of the particular account that posted and generally the content creator will need to promote the content.
- Shopping in Reels: In an effort to reduce customer dropouts for online purchases, Instagram introduced a shopping feature for creators and businesses to tag products in their videos and allow viewers to buy directly from the Reels.
- Live Rooms: A collaborative feature that allows up to four people to go live together, increasing opportunities for engagement.
- Remix Reels: This feature allows users to remix Reels to share their own take on the user’s Reels video. This is similar to TikTok’s duet feature.

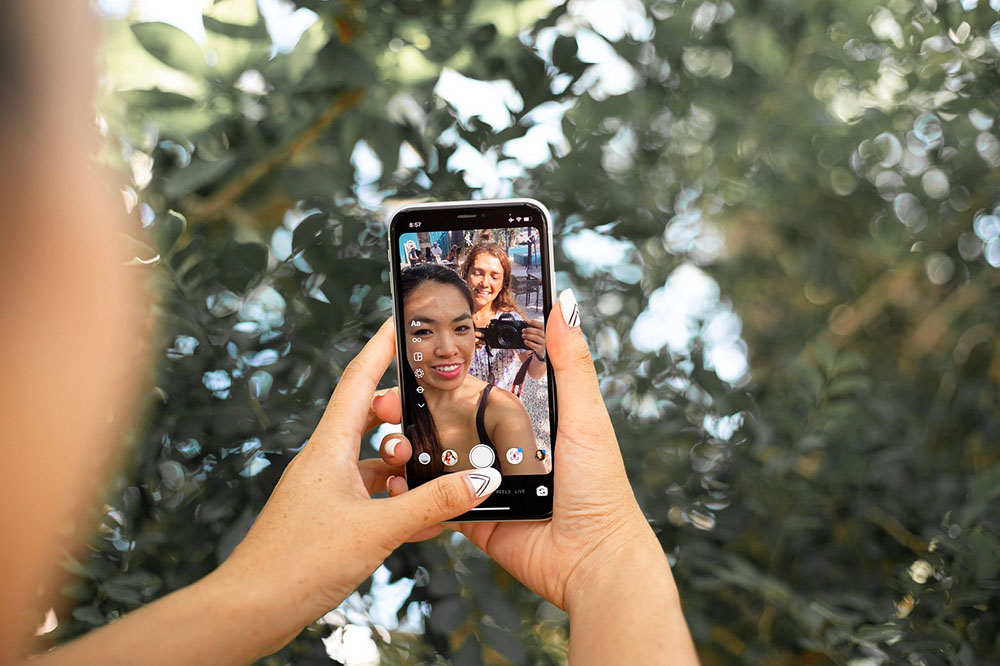
Instagram has more than 1.2 billion active users. Image: Pixabay
These are just a few of the many new features Instagram has launched in the past two years, but the platform is constantly pushing for more innovative tools and features to support creators, businesses and users alike.
With over 1.2 billion active users worldwide and at least 200 million users visiting at least one business profile every day, you can’t afford to simply rely on your own Instagram page statistics. Your page insights can offer a perspective on your account’s performance, but to thrive on Instagram you will need to refer to the statistics to create a solid strategy on how you go forward.
“Why use Instagram for your business” statistics
If you haven’t established an Instagram page for your business yet, now’s the time to do it! Image: Pixabay
- It’s the second most preferred platform for customer service
According to the 2022 Sprout Social Index, 35% of the US. consumers use Instagram for customer service. The app is only second to Facebook in terms of customer service preference.
- Instagram is the leading media platform for building relationships with brands.
A report, which came from a Meta-commissioned Ipsos Marketing Study, states that global internet users between the ages of 16-24 prefer Instagram as a platform for keeping up with their favourite brands compared to other platforms.
- The average Instagram business account fails 0.98% of followers each month.
This statistic came from Hootsuite’s Social Media Trends 2023. Another report by Hootsuite provides a further breakdown based on industry, which is:
Education: 0.03%
Entertainment and media: -1.59%
Financial services: -0.07%
Food and beverage: -0.88%
Real estate: -0.06%
Retail: -0.37%
Travel/hospitality/leisure: 0.33%
It is definitely alarming to see some negative following rates for certain industries but as you read this article you might find some helpful insights to counteract the trend.
- On average, the expected engagement rate on an Instagram business account is 0.54%.
The same Hootsuite report also highlights that video posts get a higher engagement rate at (0.61%) and a little lower on photos at (0.46%). The digital trend report by Hootsuite report also reveals an interesting paradox between the number of followers of a brand's Instagram page and its engagement rate. On average, business accounts with fewer than 10K followers enjoy a higher engagement rate than brands with 100K+ followers.
- Users spend an average of 11.7 hours per month on Instagram.
Based on the Hootsuite Social Media Trends 2023 report, Instagram users spend almost half a day consuming content on the platform. This shows the abundance of opportunity for you to create a brand impression to attract your target customers.
“What parts of Instagram can I use to maximise my business’s brand?” statistics
Instagram users tend to favour short Stories. Image: Pixabay
- The potential ad audience on Reels is 5 million users.
With the platform focusing to make Reels ads more mainstream, it's a matter of time before Reels ads surpass feed ads which can reach up to 1.32 billion users and Stories ads which can reach up to 996 million users.
- Reels are being reshared by users at least 1 billion times a day through DMs.
Finally, word of mouth is made digital through Reels. This provides a means for new accounts to discover your brand’s Instagram.
- Feed ads have a higher click-through rate (CTR) than Stories ads.
According to the Social Advertising Benchmarks for 2023 by Brafton, CTR feeds for ads on Instagram range between 0.22% and 0.88%. On the flip side, Stories have a CTR between 0.33% and 0.54%. From what we gather from these numbers, in-feed ads have a higher potential to drive clicks than Stories ads
- Brands with fewer than 10,000 followers saw the highest conversion rates (2.6%).
So big isn’t always better when you are focusing on getting conversions from Instagram. The study further elaborates that top-performing brands have an average conversion rate of 1%.
- The Instagram audience prefers short narrative-type Stories.
A study found 35% of consumers prefer Stories content that mixes photos, videos and texts.
“Who is on Instagram?” statistics
Millennials make up a majority of Instagram users. Image: Pixabay
- 60% of Instagram users are Millennials.
According to Statista, the majority of users on Instagram are aged between 18-34. Make use of this insight when you are planning your Instagram content. Specifically understanding their pain points, aspirations and visual preferences.
- 8% of Instagram users are male.
It’s important to note that Instagram limits its gender-based reporting to males and females. Although the difference isn’t significant, this insight offers an opportunity to plan for an Instagram strategy that can resonate with both male and female audiences.
- 91% of people polled claimed to use Instagram to follow an interest.
The study found that the top interests on Instagram are travel (45%), music (44%) and food and drink (43%).
- 45% of urbanites have used Instagram.
So if you are looking to reach out to more rural areas for your brand, you might be better off with Facebook. Instagram is where you’ll find cosmopolitans and suburbanites sharing their interests and hopefully discover your brand in the process!
Now that you’ve got some statistics, let’s talk strategy
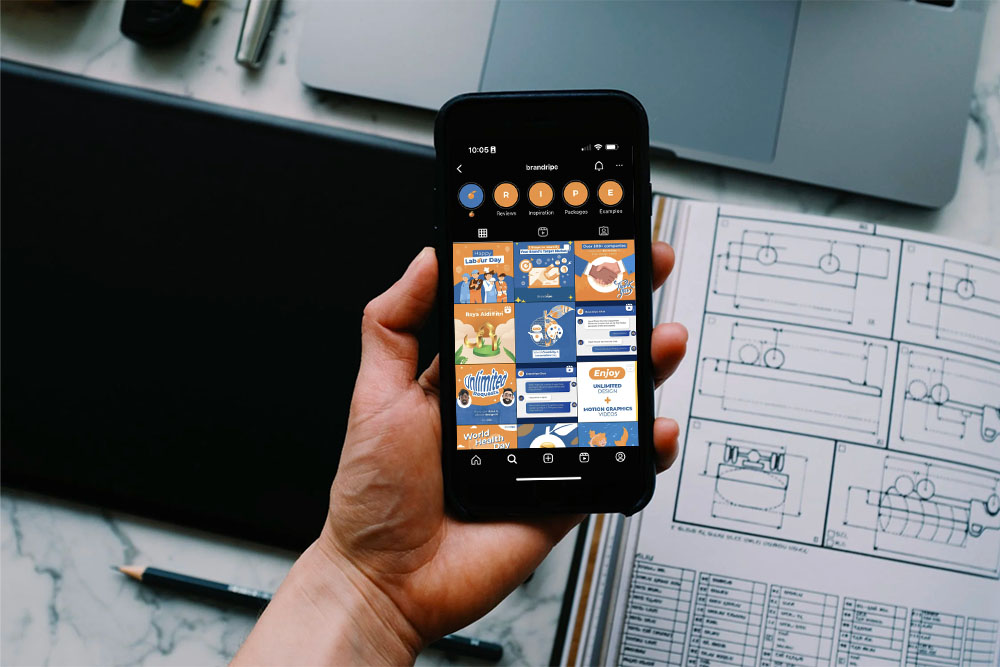
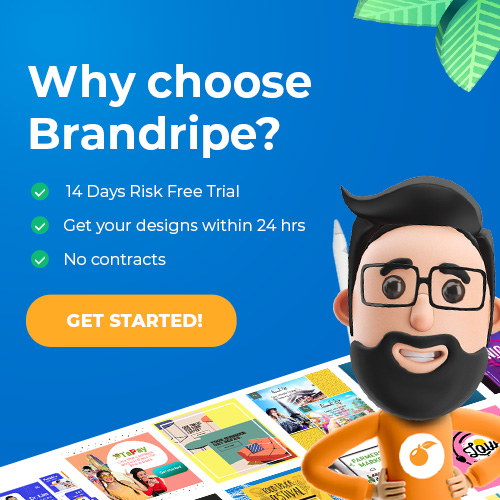
Work with Brandripe to ensure that your Instagram feed leaves a lasting impression!
You’re probably looking at all the statistics and realise you got your work cut out for you. There is still more to do after you plan your strategy – there’s content and there’s design – both of which can be time consuming and inefficient for just one person to handle.
We have just the solution that will help you take care of what your customers see!
A solid strategy is hiring an on-demand design agency for your visual needs. We can help save you a lot of time, effort and even money when you work together with our experienced creators here at Brandripe. Here are other reasons why using Brandripe is a great idea:
- No contracts, No Fuss: We completely get the fuss with red tapes and approvals if contracts are involved. Plus, we want our customers to trust us so we are happy to extend the first show of trust by not tying our clients down with legalities and formalities.
- Fixed monthly fee, Financially Friendly: From only RM 1,899 per month with unlimited revisions, this has to be the most financially friendly option you will find especially if you are comparing with an in-house designer and freelancer. In fact, you could even park multiple brands under a single account, at no extra cost.
- 24-48 hour turnaround, Operationally Efficient: Save yourself the headache especially on timeline fulfilment when you work with us to meet your design needs. For this level of turnaround from a freelancer, expect to fork out a significant amount in rush fees.
- Unlimited requests, Get Your Brand Out There: In this article, you’ve read that on average Instagram users are spending at least half-a-day on the platform, thus, it makes sense that you’d want as much content out as frequently as possible, we can help with that.
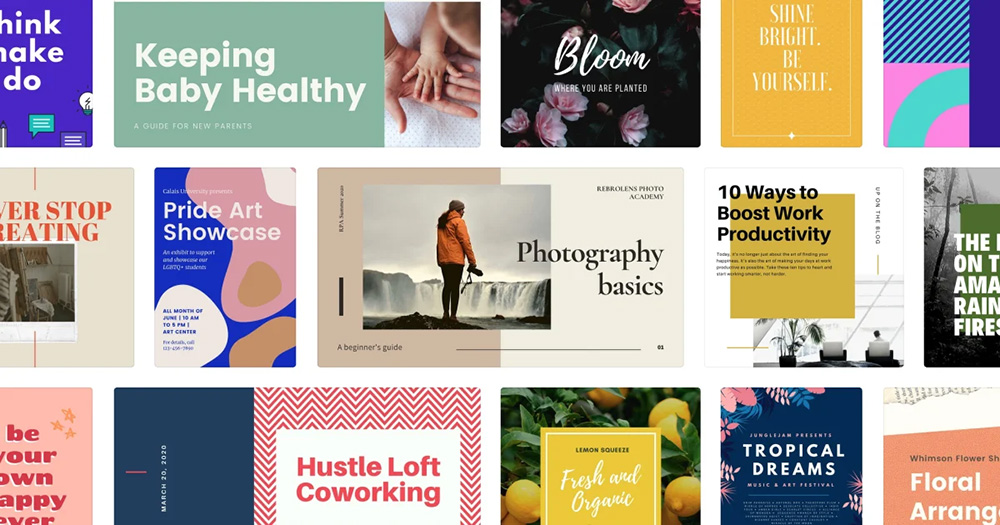
- High-Quality Designs, We Got You Covered: Our team of versatile designers has been vetted to meet industry standards and has worked with over 100 SMEs, marketing teams, startups and more. You can review our work for yourself here.
If you need more information on how we work, you can visit this page or connect with our representative who will give you the full rundown and even share our industry insights via our 15-Minute VIP Demo Call.
We are also available to answer any of your enquiries via email at hi@brandripe.com or you can also opt to reach out to our Customer Engagement team who will reply to you immediately between 10.00AM to 6.00PM.
We look forward to helping you grow your Instagram page to engage with your customers!